Notes on Performance Optimization
December 10, 2022
In my last post, I wrote a program to scan through all Unix timestamps since the Unix epoch to find timestamps that, when represented as hexadecimal, used only numerical characters. While writing that program, I had a bit of fun playing performance golf, trying to get it to run as fast as possible, just for fun. In this post, I will share some techniques and the thought process that went into this performance optimization.
Parallelization
My laptop has 10 cores. This program doesn’t use any disk or network I/O, and so, unlike basically all the problems I deal with professionally, it is CPU- bound. Let’s put all the CPU cores to work. To do this, I divided the time range into smaller ranges (one for each CPU core), and spawned a Goroutine for each section of time. Now all 10 CPU cores can churn through the work in parallel. At the end, each Goroutine increments an atomic integer (a handy new feature from Go 1.19) to report its result. Finally, the program uses a wait group to wait for all of the Goroutines to complete their work before exiting.
Reducing allocations
At this point, the program feels decently fast. It could scan all 1.7 billion
timestamps in about 10 seconds, which was almost good enough to work on the
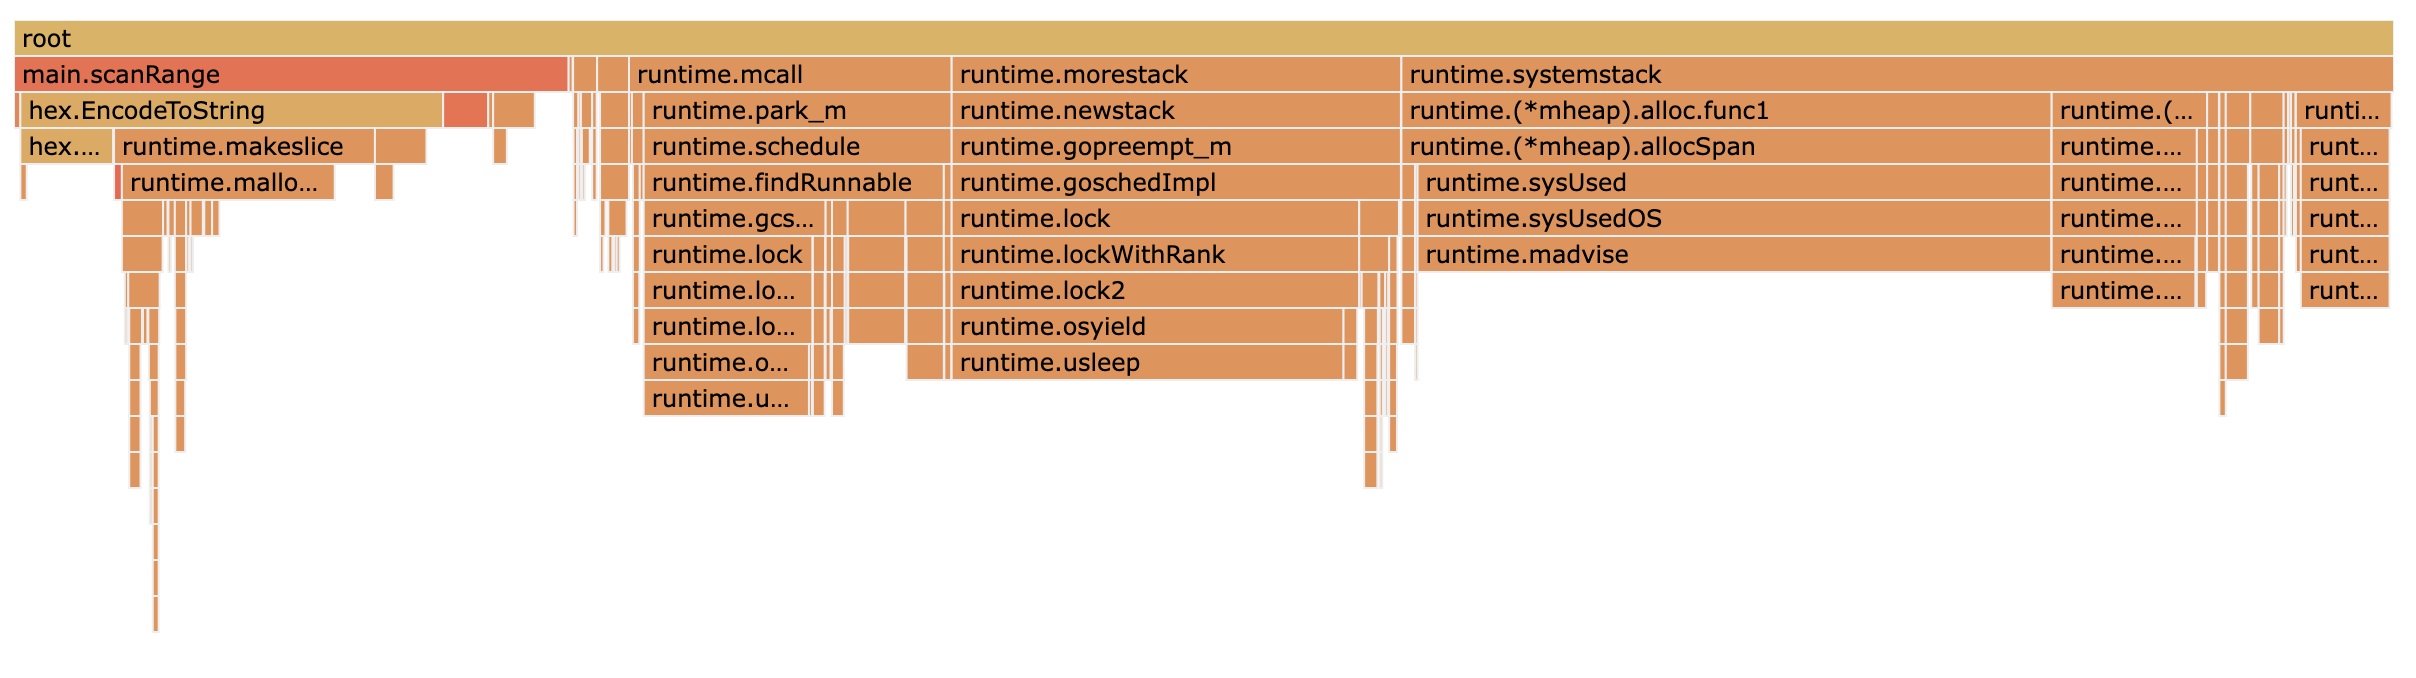
program iteratively. But what if I could make it even faster? Using Go’s
profiler, I can look into what the CPU is spending its time on. In the flame
graph below, the piece that stands out is that we’re spending 22% of our time
in hex.EncodeToString with its mallocgc call below. In a CPU-bound program,
eventually memory allocation itself becomes a bottleneck, so unnecessary
allocations should be eliminated.
Reading the standard library source
code, I
can see that EncodeToString allocates a new byte slice for each execution. By
switching to Encode, we can re-use the same output byte slice each iteration,
thus reducing allocations. And sure enough, with the change from
EncodeToString to
Encode,
we’ve reduced billions of unnecessary string allocations and are reaping the
benefits: the program now runs in about 1.7 seconds seconds, which is a 5.8x
speedup!
Eke out
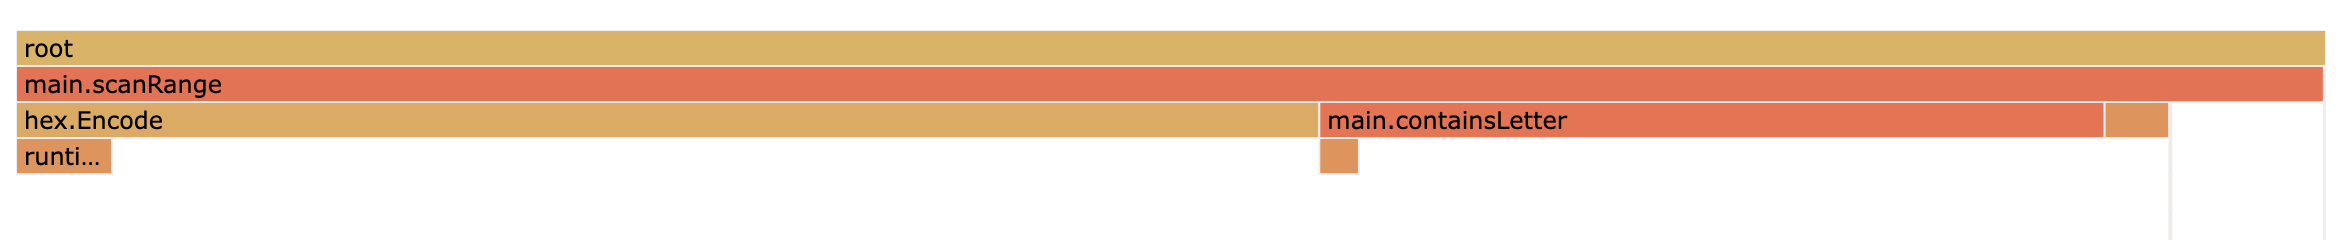
At this point I was close to calling it done. Most of our time is spent in
hex.Encode. This standard library code is well-optimized by the brilliant Go core team–how can I
improve on this? We could perhaps eke out a bit more performance through
laziness. That is, rather than hex-encoding an entire 32-bit timestamp, then
iterating over the result to scan for letters, we instead hex-encode each byte
in the timestamp (which, as an unsigned 32-bit integer, is 4 bytes) and consider
each hex value individually. In other words, we would short-circuit the
hex-encoding process by aborting if any letters were found. This way, we could
save up to 3 hex-encode operations per timestamp. I tried this, but couldn’t
discern any speedup.
However, after this change, another avenue presented itself: the program was iterating over a range of just the two characters when it could access each of the two locations in memory directly with array indexing. Sure enough, replacing range with array indexing brought the program’s run time down as low as 1.3 seconds. This is a respectable savings—in a real production program or library finding a 30% performance increase can be extremely valuable.1
At this point, we’re starting to scrape the bottom
of the barrel. We could go further, cribbing from the hex.go
internals
to potentially halve the amount of work being done by examining half a
hexadecimal value at a time, but instead let’s move on to an even more fruitful
approach.
Turning the problem on its head
There is an old adage that the best way to make a program faster is to make it do less work. So far we’ve been doing the same amount of work, but making the work faster, until eventually reaching a dead end. Lately, I’ve been inspired by this Causal blog post, which asks the question: “what do you do once you’ve reached a dead end with the profiler?” In the post, they link to the fabulous talk by Andrew Kelley, A Practical Guide to Applying Data-Oriented Design. One of the lessons from the talk is that some performance wins come from knowing patterns about the data a program is dealing with. The approach I’ve taken above is a brute-force search. It’s counting. What if, instead of counting, we exploited our knowledge of the data we’re working with to unlock new ways of solving the problem? It turns out we can not just make the program faster, but obviate it entirely.
Unix timestamps are 32-bit integers, and thus consist of 4 bytes. And each
byte, when encoded in hexadecimal, has 100 possible values that can be
represented with numerical values (00–99). This means that for all 32-bit
integers, there are 100*100*100*100 numbers that can be represented with the
numerical hexadecimals: 100,000,000. There are cobwebs, but I can remember
learning this in middle school. But for our problem we’re not considering all
32-bit integers, only the ones up until the present day: December 16, 2022 as
I’m writing this. The Unix timestamp for the start of today is 1671166800
(0x639bfb50). The first byte is represented by 63 in hex which, including
00, is the 64th hexadecimal value. That means, to get all the combinations
of numerical hex values up to this timestamp, we must compute
64*100*100*100 or 64,000,000. 64 million, divided by our starting timestamp,
1671166800, comes to 0.038297.
Now we’ve arrived at our answer in a single instantaneous computation: 3.8% of Unix timestamps until the present day can be represented with just the numerical hexadecimal digits. In retrospect this solution is painfully obvious.
Conclusion
Thank you for joining me on this journey of performance golf. Optimizing a CPU-bound program is not something I get the pleasure of doing in my day-to-day work, but it turns out to be quite satisfying, so hopefully I get the chance some time soon. And of course, as we’ve learned, no program can be faster than not needing a program at all!
-
I was surprised by how much faster array indexing was compared to ranging over a small slice. I’ve put together a benchmark showing just how much faster it is. Scroll down to see the ARM64 assembly for the two implementations, which help explain the difference. Clearly the range method has to perform a lot more work. ↩